Let's talk about such an important criterion for assessing the value of an enterprise as economic added value ( Economic Value Added). Let's consider the formula for calculating this indicator, methods of its analysis and management. Let's conduct a comparative analysis with other approaches to company valuation.
Economic added value. Definition
In the modern economic environment, economic value added is an indicator of assessing the value of a company/enterprise for owners/shareholders.
Economic added value (EnglishEVA,EconomicValueAdded) is an indicator of the economic profit of an enterprise after paying all taxes and fees for all capital invested in the enterprise.
EVA vs Net Profit
Formula for calculating economic added value
Economic value added shows the excess of net operating profit after taxes and the cost of using capital. The formula for calculating EVA is given below:
NOPAT(English Net Operating Profit Adjusted Taxes) – profit from operating activities after taxes, but before interest payments ( NOPAT=EBIT (operating profit)–Taxes (tax payments));
WACC (English Weight Average Cost Of Capital) is the weighted average cost of capital, and represents the cost of equity and borrowed capital, that is, the rate of return that the owner (shareholder) wants to receive on invested money;
C.E. (English Capital Employed, Invested Capital, Capital Sum) – investment capital, is the sum of total assets ( Total Assets) based on the beginning of the year minus non-interest-bearing current liabilities (payables to suppliers, budget, advances received, other payables). In the balance sheet, investment capital is the sum of the lines “Capital and reserves” (line 1300) and “Long-term liabilities” (line 1400).
To calculate the weighted average cost of capital (WACC), we use the following formula:
![]()
Where: R e ,R d – expected/required return on equity and debt capital, respectively;
E/V, D/V – share of equity and debt capital in the capital of the enterprise;
t – interest rate of income tax.
What does economic value added show?
Economic added value shows the efficiency of an enterprise's use of its capital and shows the excess of the enterprise's profitability over the weighted average cost of capital. The higher the value of economic added value, the higher the efficiency of capital use of the enterprise. Efficiency is determined by exceeding profitability and cost of capital (debt and equity). Large EVA values indicate a high rate of additional return on capital. Comparing the EVA of several enterprises allows you to choose the one that is more attractive for investment.
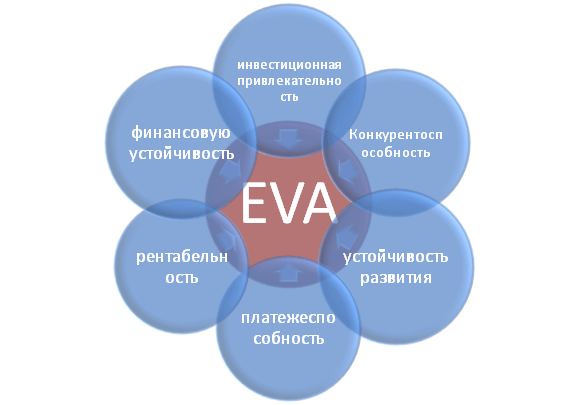
The EVA indicator reflects various categories of enterprise activity: investment attractiveness, competitiveness, financial stability, solvency, sustainability and profitability. The figure shows schematically the relationship between EVA and other plant characteristics.
Users of the indicator economic added value of the enterprise
The users of this criterion are shareholders, top managers, and investors who evaluate changes in EVA as an integral criterion for the economic attractiveness and efficiency of enterprise development.
| Users | Purposes of use |
| Shareholders/Owners | Assessment of economic added value, analysis of the main factors of its formation, increasing its attractiveness to investors. |
| Top managers | Assessing the economic added value of an enterprise and developing management tasks, regulations, plans and standards to increase this indicator. |
| Strategic investors | Assessing the efficiency of an enterprise's use of its capital, carrying out mergers and acquisitions of promising companies. |
Economic Value Added in the Value Based Management system
Based on the EVA indicator, the VBM enterprise management system is built ( ValueBasedManagement). This enterprise management system is based on maximizing economic added value. The goal of all management decisions at an enterprise is to increase value for shareholders and owners. Finance serves to create a positive return on investment over invested capital. In this system, corporate governance serves to develop a system for measuring the contribution of managers to the growth of the company's value and a system for their material motivation and reward.
Economic studies on the importance of economic value added indicator
Thus, in her work, Gabriela Chmelíková (in 2008) proved that the EVA indicator has a strong correlation with such classic indicators as ROA and ROE. This proves that EVA is a better indicator of shareholder sentiment than traditional measures. Research by Klapper, Love, Jang, Kim (2005) proved that the EVA coefficient has a positive correlation with sales volume, leverage, age and company/enterprise size. A particularly strong influence on the EVA indicator is the corporate one, expressed by J. Tobin's coefficient (Q). These studies once again prove the importance of this indicator, which characterizes the efficiency of an enterprise.
Example of EVA calculation for OJSC ALROSA
In order to better understand the meaning of economic value added (EVA), let’s look at a practical example of how this indicator is constructed. Since all indicators are based on international reporting, they do not exactly coincide with domestic analogues. The result, in a simplified version, is the following formula:
EconomicValueAdded= Net profit – WACC*(Capital and reserves + Long-term liabilities)
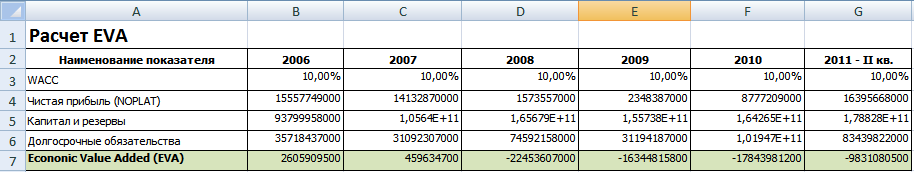
The table below shows the calculation of EVA for the enterprise OJSC ALROSA.
The enterprise's net profit is taken from balance sheet line 2400 and is the final result of the organization's activities (NOPLAT).
The sum of “capital and reserves” and “long-term liabilities” forms the enterprise’s investment capital (CE).
To calculate WACC, you can compare ROE (return on equity, profitability) indicators for similar companies in the same industry. In this example, the profitability of enterprise capital management (both own and borrowed) was taken at the rate of 10% per annum.
Economic Value Added = B4-B3*(B5+B6)
Control levers in the EVA model
Based on the above formula, we can identify the main levers and factors for managing economic added value (NOPLAT, WACC and CE):
- increasing the profitability/profitability of the enterprise by increasing sales volume. This can be achieved by developing marketing strategies for product promotion. The second direction is reducing costs in the production of products through the use of new technologies, materials, raw materials, highly qualified personnel, etc.;
- managing the cost of borrowed capital: reducing the interest rate through on-lending, obtaining an international/national credit rating;
- capital management. Liquidation of low-profit assets, search for new areas of capital investment.
Resume
For the sustainable development of a company/enterprise, a single criterion for assessing value for owners is required, which allows one to link the strategic and operational levels of management. The economic value added (EVA) indicator is one of the most common indicators for an owner to assess the value of his business. Based on the EVA indicator, a VBM (Value Based Management) enterprise management model is built, where all enterprise indicators affect changes in added value. To stimulate managers in actions aimed at increasing value, based on this model, various systems for assessing contributions and monetary incentives are being developed.
R.A. Andrutsky Chief economist for business planning of NII TK LLP, Master of Economics
Journal "Accounting and Finance", No. 7 for 2008
Balance (‘000 cu)
|
Assets |
Liability and capital | ||
|
Current assets |
Current liabilities | ||
|
Cash and cash equivalents |
Short-term financial liabilities | ||
|
Short-term receivables |
Short-term accounts payable | ||
|
Other current liabilities | |||
|
Other current assets |
Long-term liabilities | ||
|
Long-term assets |
2 833 000 |
Long-term financial liabilities | |
|
Long-term accounts receivable |
Capital |
1 723 000 |
|
|
Fixed assets |
Issued capital | ||
|
Intangible assets | |||
|
Other long-term assets |
Retained income (uncovered loss) | ||
|
Balance |
3 198 000 |
Balance |
3 198 000 |
Profit and loss statement (‘000 cu)
|
Sales income | |
|
Cost of sales, incl. | |
|
Operating expenses | |
|
Depreciation | |
|
Administrative expenses | |
|
Marketing expenses | |
|
Profit from operating activities | |
|
Interest expenses | |
|
Profit (loss) before tax | |
|
CIT expenses, 30% | |
|
Total profit (loss) for the period |
In the first step, we will determine NOPAT using data from the Income Statement. Then, in subsequent calculations, we use the balance information. In the second step we calculate ACE. To do this, the company's interest liabilities are added to the capital. Next, WACC is determined taking into account the tax shield on debt capital. And in the fourth step we calculate EVA.
1. NOPAT = 535,000 − 123,000 = 412,000 USD
2. ACE = 1,723,000 + 850,000 + 275,000 = 2,848,000 USD
3. WACC = 0.37 × 12% + 0.63 × 14.7% × (1 − 0.3) = 11%
4. EVA = 412,000 − 11% × 2,848,000 = $100,903
The resulting EVA indicator > 0, that is, the company creates added economic value to shareholders.
Conclusions.
EVA strategy is one of the most popular initiatives in the field of value-based management, which allows you to radically reconsider the company's goals and values. The company must be fairly assessed by both potential investors, clients, partners, and owners, so EVA retains its place in the system of key indicators and, in addition to other functions discussed in this article, constantly reminds of the role of the company's owners. EVA in the management system allows for strategic and operational planning, measurement and control of results. I think that for a company aimed at creating value for shareholders, the relevant question will not be “to use or not to use EVA in management?”, but the question “how and to what extent to use EVA?”
1 The data is fictitious.
2 The example shows a simplified version of the definition of ACE; in practice, it is recommended to take the average values of the elements of this indicator at the beginning and end of the reporting period.
One of the most popular indicators in modern financial management is the EVA indicator. The concept of economic value added has been increasingly used in recent years in economic theory and, mainly, in the practice of companies in various countries.
Economic added value is a fairly universal indicator that can be used for financial analysis, management and assessment of the value of a company. This is, in essence, a profitability indicator that does not have the disadvantages of the indicators that were used for this purpose until recently. The fact is that the classic indicators for measuring the profitability of a company are various profitability indicators (ROE, ROI, etc.), calculated on the basis of accounting data based on the results of business activities. These indicators have a number of disadvantages:
Using legal accounting techniques, it is possible to artificially increase or decrease the amount of reported profit;
Accounting indicators do not reflect the time value of money and, above all, the risks of investors;
The profitability indicators of a particular company do not sufficiently correlate with the value of its shares on the capital market, which can mislead those making decisions regarding the development of this company.
To eliminate the above-mentioned shortcomings, the concept of “free cash flows” (FCF) was proposed in the 80-90s. The use of cash flows made it possible to exclude profit from calculations and introduce discounting of cash flows (Discounted Cash Flow - DCF), which takes into account time and risk factors using a discount rate. It should be noted that the DCF method is more beneficial for assessing the value of a company, but is not suitable for the operational and ongoing management of companies, since it cannot be used to calculate indicators that are most relevant to managers.
In turn, the emergence of the EVA indicator was caused by the need to find an economic indicator that would:
Reflected a close relationship with the share price, established using statistical methods;
Provided the opportunity to use the largest amount of information from accounting, including indicators calculated based on accounting data (to simplify calculations);
Gave an assessment of the company's value taking into account the risk factor.
This implies the dual nature of the EVA indicator - it can be used as a tool for both financial analysis and company assessment.
According to the EVA concept, the value of a company is its book value increased by the current value of future EVA.
It is obvious that the greatest increase in the value of any company is primarily caused by its investment activity, which can be realized both from its own and from borrowed sources. The main idea that justifies the advisability of using EVA is that investors (who may be the owners of the company) of the company should receive a rate of return for the risk taken. In other words, a company's capital should earn at least the same rate of return as similar investment risks in the capital markets. If this does not happen, then there is no real profit, and shareholders do not see the benefits of the company's investment activities.
Thus, a positive EVA value characterizes the efficient use of capital, an EVA value equal to zero characterizes a certain kind of achievement, since investors actually received a rate of return that compensated for the risk, a negative EVA value characterizes the inefficient use of capital.
On a macroeconomic scale, capital productivity is the factor that has the greatest impact on the economy, and as a result, on GDP growth. Any economy is characterized by a certain “stock” of capital, which leads to the emergence of new GDP. The more productive the capital, the greater the GDP we have. Therefore, achieving the highest possible EVA is not only a positive factor for shareholders in terms of managing the value of the company, but also for the entire economy and is important for each individual in a broader perspective. In practice, this moment characterizes the possibility of the most effective redistribution of capital from one industry to another, which allows the industry to develop and receive additional income.
Another function of EVA is related to the possibility of its use as a tool for motivating personnel to make and implement effective management decisions. Indeed, by determining the cost of using equity capital for each division, it is possible to distribute it more effectively and identify unprofitable business divisions that are financed at the expense of profitable ones. EVA helps managers see exactly where value is created and manage cash flow effectively. Since the EVA indicator is “decomposed” into components that reflect the role of individual groups or divisions in creating added value, it allows the formation of separate criteria for differentiated remuneration for the work done in the company.
As part of company value management, EVA is used: when drawing up a capital budget, when assessing the performance of departments or the company as a whole, when developing an optimal and fair bonus system for management. The advantages of applying this concept within the framework of company value management are associated with an adequate and non-labor-intensive determination, using this indicator, of the degree to which a division, company or individual project has achieved the goal of increasing market value.
So EVA:
Is a tool for measuring the "excess" value created by an investment;
It is an indicator of the quality of management decisions: a constant positive value of this indicator indicates an increase in the value of the company, a negative value indicates a decrease;
Serves as a tool to determine the rate of return on capital, highlighting part of the cash flow earned through investments;
Based on the cost of capital as a weighted average of various types of financial instruments used to finance investments;
Allows you to determine the value of the company, and also allows you to evaluate the effectiveness of individual divisions of the company (individual property complexes)
The author of the Stewart concept defined the indicator of economic added value as the difference between net operating profit after taxes (NOPAT) and capital costs (capital charges). That is, EVA allows us to estimate the real economic profit at the required minimum rate of return that shareholders and creditors could receive by investing their funds in securities with the same level of risk. The logic behind EVA is that net operating profit after tax (NOPAT) is the income generated after subtracting expenses and depreciation. Part of this income goes to pay the costs of using resources (expressed in the cost of equity and debt capital), and the other part is the created value, which is measured by EVA. This concept is based on the fact that it is not enough for a company to have a positive financial result or an acceptable level of income per share; any economic unit in the course of its economic life must reach a level of development at which it is possible to create new value. New value is created only when a company receives a return on invested capital that exceeds the cost of raising capital.
EVA = NOPAT - CAPITAL COST EVA = NOPAT - COST OF CAPITALx x CAPITAL EMPLOED, (2.2.1)
where NOPAT is net operating profit less taxes, but before interest;
COST OF CAPITAL - weighted average cost of capital (WACC);
CAPITAL EMPLOYED - valuation of capital.
If the rate of return is the ratio of net operating profit minus taxes to capital, then formula (2.2.1) can be written as follows:
EVA = (RATE OF RETURN - COST OF CAPITAL) X CAPITAL, (2.2.2)
where RATE OF RETURN = NOPAT/CAPITAL
CAPITAL - balance sheet minus interest-free loans as of the beginning of the year. Sometimes the CAPITAL indicator in this formula is replaced by the total assets indicator (TOTAL ASSETS), which consists of debt and equity capital.
In addition, the above formula can be written as:
EVA = (ROI - WACC) X CAPITAL EMPLOYED, (2.2.3)
where ROI is the return on invested capital.
EVA can be calculated using the following formula:
EVA = NOPAT - WACC X TA, (2.2.4)
where TA - total assets;
WACC is the weighted average cost of capital.
As an alternative option for calculating EVA, the following calculation option can be proposed:
EVA=NOPAT - WACC X (TA - Net Profit), (2.2.5)
where Net Profit is net profit.
The attractiveness of the economic value added indicator is that it is based on adjusted accounting data. To construct it, Form No. 1 “Balance Sheet and Forms” No. 2 “Profit and Loss Statement” is sufficient. It can be said that one of the goals of EVA is to revise the so-called “accounting” approach to management decision making.
As part of company value management, the main factors involved in the formula calculation can be detailed based on smaller components (Appendix 3).

By increasing the value of EVA by influencing the factors involved in the model, the manager increases the value of the company.
EVA can be increased as follows:
Increasing business profitability by increasing sales income and reducing costs (saving and optimizing current costs (reducing unprofitable production, etc.)).
Optimization of capital costs.
Estimation of company value based on EVA indicator.
Company value =
Previously invested capital
Current value added from capital investments
The sum of current added values from new projects.
Despite a number of obvious advantages, the disadvantages of the EVA indicator should also be taken into account:
The value of the EVA indicator (as well as any indicator based on the concept of residual income) is significantly influenced by the initial assessment of the invested capital (if it is underestimated, then the added value created is high; if it is overestimated, then, on the contrary, it is low). At the same time, the author of this model proposes a number of adjustments to the balance sheet value of invested capital, which can also introduce additional subjectivity into the calculations and non-reflection of the real market situation;
The main part of the added value within the framework of the EVA model falls on the post-forecast period, which represents an “adjustment” - the “non-accounting” of the real value of invested capital in the added values of the forecast period. In order to remove a certain subjectivity in the calculations, the author recommends assessing not the absolute value of EVA, but the annual increase in this indicator.
Thus, this model will help the manager:
Monitor changes in the company's value over time;
See what factors influence changes in the company’s value and track the magnitude of their influence;
Build a system for making operational decisions based on the strategic goal - increasing the value of the company;
Build a diagram of interrelated indicators that influence the achievement of the goal;
Identify bottlenecks in a timely manner (declining rates of change in indicators and other critical trends) and respond to them in a timely manner;
Get a strategic management tool;
Have a generally accepted and understandable indicator for investors that characterizes the efficiency of the enterprise.
This indicator is simple and effective to use; it can be calculated both for the enterprise as a whole and for individual investment projects. EVA® can be used both as a tool for making investment decisions and as a universal indicator for comparing the performance of individual divisions or enterprises of the holding. Although this indicator uses a large number of assumptions and forecasts when calculating, it allows you to take into account all the factors affecting the efficiency of the enterprise. The EVA® indicator was developed by the American company Stern Stewart & Co in the 90s and is now widely used among the world's leading companies.
The introduction of a cost model of business management is becoming increasingly popular. Within this concept, the main goal of a company is to maximize its value. It is believed that this criterion most accurately reflects the efficiency of a business.
One of the main stages of building a cost model is identifying key cost factors. In other words, interrelated indicators (both financial and non-financial) that allow you to evaluate a business and manage the effectiveness of its development.
EVA Economic Value Added Model
Various models can be used to estimate the value of a business. For example, SVA (Shareholders Value Added), MVA (Market Value Added), EVA (Economic Value Added), CFROI (Cash Flow Return on Investments) and a number of others. Orientation towards one or another model can depend quite strongly on the specifics of the business, the capital intensity of production, the situation in the industry and other factors.
Currently, in most companies there is a significant discrepancy between the book value and market value of assets. The increase in this gap is partly due to the increasing role of intangible assets (intellectual capital, reputation, etc.). In addition, there is a need to take into account “shadow” assets (good relationships with suppliers and clients, the ability to use influence resources, etc.). They can also be measured as Equity Equivalents. The lack of a methodology for fair valuation of intangible assets and their presentation in financial statements is the main reason for companies' orientation towards modern models of corporate financial management. According to most experts, EVA is the most universal cost indicator of business performance. It can be calculated not only for enterprises whose shares are quoted on the market, but also for closed companies. In Russian conditions this is quite relevant.
The EVA indicator is defined as the difference between the adjusted net profit and the value of the company's invested capital (equity and borrowed funds) used to obtain it:
EVA = NOPAT (adj) – WACC x CE (adj) , where
NOPAT (Net Operating Profit After Taxes) – net operating profit after taxes, adjusted for changes in equity equivalents;
WACC (Weighted Average Cost of Capital) – weighted average cost of capital;
CE (Capital Employed) - the amount of invested capital, taking into account equity equivalents. This indicator is the sum of all assets related to the operational management of the object being assessed, minus short-term operating liabilities (commercial loans, debts to the budget, etc.). As already mentioned, the object of assessment can be both the entire company and its individual divisions. When calculating the CE indicator, it is important not to forget assets that are shared by several business units (indivisible assets). They must be taken into account in an amount proportional to the degree of use by the object of assessment.
(adj) – Adjustments (Equity Equivalents) - adjustment taking into account changes in equity equivalents
Despite the apparent simplicity of the presented calculation model, when determining the EVA indicator, problems arise in the correct assessment and accounting of equity equivalents (Equity Equivalents). The authors of the original method for calculating EVA propose about 160 amendments that make it possible to more fully take into account the value of the intangible assets used. In particular, such amendments may include separate accounting of reserves for “bad” debts, accounting for deferred taxes, taking into account the risks associated with investing in securities, investment risks, the “social” image of the company, etc. This is important because in some cases these assets can significantly affect the market valuation of a business.
The EVA indicator can be used both for the investment assessment of the company as a whole, and for assessing the effectiveness of its individual analytical objects: business lines, investment projects or structural business units (SBUs). In particular, when implementing the EVA model, you can use the company’s existing classification of financial responsibility centers.
When calculating the EVA indicator for a structural unit (or for a specific project), it is necessary not only to determine the shares of assets used by it, but also to correctly calculate the cost. It is formed by direct and indirect costs associated with a specific accounting object (structural unit, product or line of business). Moreover, it is quite easy to take into account direct costs (Operating Direct Cost), but certain difficulties may arise with the calculation of indirect costs (Overheads). As a rule, they are caused by the methodology for allocating overhead costs to responsibility centers. To solve these problems, you can use the company's existing budgeting models, which are based on a similar logic. If this is not possible, then new calculation models will need to be created. One of them is the operational costing method - ABC (Activity Based Costing).
Generalized scheme for implementing the EVA model
The implementation of the EVA model begins with the analysis and weighting of cost parameters (marginal profit, weighted average cost of capital, invested capital, shadow assets). They are the ones who determine the EVA value. This should take into account such factors as: industry specifics, life cycle phase, structure of invested capital, degree of capital intensity of the business, level of technological equipment and the presence of a developed resource base, risk management policy, the presence and degree of influence of “shadow” competencies, etc. .
Then the management objects are ranked (price and quality of products, volume of discounts, degree of workload of resources used, policies for managing receivables and payables, tax burden, etc.) according to the degree of their influence on the calculated EVA indicator. To assess the degree of influence of a particular indicator, weight analysis is used - it is determined how much the EVA value will change if one of the parameters changes by 1 percent (with all other values fixed). Next, each control object is assigned appropriate weighting coefficients. For some lines of business, an increase in the pace and volume of sales may have a stronger impact; for others, more efficient asset management and a reduction in ongoing operating costs, etc.
After this, it is necessary to determine the degree of influence of each of the groups of managers (top management, operational management, functional management, etc.) on one or another indicator involved in calculating the EVA value. Each group is also assigned appropriate weighting coefficients, usually by expert assessment.
Thus, we received two groups of coefficients. The first includes indicators of the influence of control objects on the calculated EVA value. The second is the coefficients of influence of a particular group of managers on these indicators. Based on this, generalized weighting coefficients can be calculated that will reflect the degree of influence of each manager on the target EVA value.
Finally, policies and mechanisms for motivating staff are developed. Naturally, the focus is on the managers who have the greatest influence on the drivers of value creation. Intensifying their efforts aimed at creating a positive trend in the EVA parameter will in the future lead to an increase in business value.
EVA value control
The main strategic objective of management is to increase the value of the business. Therefore, the task of effective EVA management comes down to ensuring a stable non-negative value of this indicator. Its positive dynamics mean that the company's business is developing more efficiently than the market as a whole. Consequently, as EVA increases, the investment attractiveness of a given company increases. Conversely, if there is a steady trend towards a decrease in the EVA indicator, then we can talk about a decrease in the value of the company and a drop in the interest of external investors in it.
Maximizing EVA growth with effective asset management comes down to identifying factors that allow you to achieve:
- operating profit growth (NOPAT);
- minimizing the cost of capital used with an optimal ratio of equity and borrowed funds.
- increasing sales growth rates;
- increase in asset turnover;
- building an effective ratio of assets by liquidity groups;
- reduction of total costs of production and sales of products.
Optimization of the capital structure and management of its value occurs in two directions. The first is to attract cheaper borrowed funds (but taking into account the optimal ratio of equity and debt capital). The second is the redistribution of financial reserves between the company's investment centers, based on maximizing the profits created by these centers.
Another important aspect when using the EVA model is solving the problem of optimizing the ratio of profitability (Profitability) or spread (Spread) and business growth rate (Growth Rate). The spread is calculated using the formula:
Spread = ROCE-WACC, where
ROCE (Rate Of Return On Investors Capital) – return on invested capital,
WACC – weighted average cost of capital.
Based on the analysis of existing statistical data, an average result was obtained (Scheme 1). This matrix allows you to classify companies according to the degree of their attractiveness to external investors and the market as a whole, based on estimates of spread and growth rates. The most attractive are the companies of group “A”. For them, the spread value exceeds 2.5 percent, and the growth rate of sales volumes is more than 25 percent per year.
Companies belonging to groups “B” and “C” have a certain potential (either to increase sales growth rates or to increase profitability). They may also be of interest to external investors (primarily Group C companies).
Group D companies have low performance and, accordingly, low investment attractiveness.
Stages of implementing an EVA-based management model
Stage 1. First of all, it is necessary to develop a long-term strategy based on assessments of the company's development prospects. To do this, you should analyze alternative strategies and select the most optimal one. Naturally, the chosen development strategy of the company must be constantly analyzed for its compliance with the current market situation.
Stage 2. Managers must come to understand the EVA ideology. Quite often they focus on short-term goals, for example, increasing profits in the current period. At the same time, they do not monitor the efficiency of use of resources in which the fixed capital of the company’s owners is contained.
It is necessary that the company's management is clearly aware of the fact that equity capital, which has a certain value, is used in operational work. Its value should not be lower than the average market profitability for this market segment. In other words, we need to strive to ensure that in all business cycles the return on invested capital (ROCE) is no less than the cost of attracting it (WACC).
Stage 3. A calculation methodology is developed and target indicators are determined (return on invested capital ROCE, ratios reflecting the company's capital structure, balance sheet liquidity indicators, working capital, etc.). At this stage, it is necessary to create calculation models of the main parameters involved in the formation of EVA. In particular, it is necessary to determine:
- methodology for calculating net profit taking into account all adjusting indicators (base and distribution coefficients of overhead and general corporate expenses, etc.);
- methodology for calculating the amount of capital with determining its optimal structure;
- minimum level of profitability by structural divisions (projects, products, business lines);
- system for planning current activities and drawing up forecast budgets;
- a system of motivation and evaluation of personnel performance in order to orient them towards increasing the EVA value for the entire company as a whole.
Stage 4. At the final stage, the methodology of this management model is introduced into the current operational activities of the organization. This stage involves management’s awareness of the need to use a cost approach to business management. At the same time, appropriate management technologies are being introduced. For example, a balanced scorecard system, functional cost analysis, construction of budget models based on multidimensional analytical cubes and others.
Scheme 1. Classification of companies by degree of attractiveness based on spread indicators and growth rates
The EVA (economic value added) indicator proposed by the consulting company Stern-Stewart is an assessment of the economic profit of the organization. Essentially, it is the profit earned by the organization reduced by the cost of capital.
The key question this metric helps answer is how successful are we in delivering returns to our shareholders?
EVA - Economic Value Added
This indicator is used as a mechanism for internally managing a company's operating activities and investment decisions to ensure that investors meet or exceed investor expectations.
EVA is a measure of economic returns that exceed investor expectations and, barring accounting anomalies, serves to directly compare companies with the same risk profile. Examples of anomalies include R&D and training costs; According to the theory, these are investments that should be considered as such.

The ability to accurately compare performance is based on the cost of capital. According to the EVA approach, organizations earn profits only when they include the cost of capital in the calculation of financial performance. Capital is never free. There is an opportunity cost of capital, i.e. investors can invest their funds in different instruments (government bonds, banks, etc.). To get the actual profitability of a business, it is important to subtract the cost of capital from profits. Capital is accounted for both debit and credit. Capital is a measure of all the money invested in a company throughout its existence, regardless of its source.
EVA is also actively used to set the size of incentive bonuses for managers. What's particularly interesting in our post-crisis world is that the bonus structure encourages a careful balance between short-term and long-term financial performance (which protects the interests of shareholders with long-term investments in the company). Moreover, the approach to calculating bonuses is being improved so that managers share the “sorrow and joy” of investors. As the CEO of one organization that implemented an EVA bonus approach said, “We want to make sure that the people who work for [the company] have the same goals as the people who invest in the company.”
The incentive payment model is based on a bonus bank. The way the bonus pot works is that each year the bonus amount is determined based on the EVA compared to its target value and this bonus is then placed into the bonus pot. Typically, a third of this bonus is paid for the current year, and the remainder is retained as a payment for the risk of EVA decline in subsequent years.
It must be emphasized that employees should be rewarded for the results of the previous year, this will contribute to improvements in subsequent years. It is also important to note that bonuses are not necessarily paid when EVA is positive, as the trend may be downward. Conversely, if a division started the year with a significantly negative EVA but showed significant positive growth during the year, then bonuses may be paid even if the final EVA remains in the negative.
How to take measurements
Information collection method
The data is taken directly from the income statement and takes into account the cost of capital charge.
Formula
Economic Value Added = Net Operating Income After Taxes - (Cost of Capital × Capital Employed).
EVA = NOP AT - (C × K),
where NOPAT is net operating profit after taxes;
C is the weighted average cost of capital (WACC), which is the average rate at which the company expects to raise funds from shareholders to finance its assets; K - used economic capital.
The cost of capital in organizations is measured using the CAPM (Capital Asset Pricing Model) method. The company's nominal cost of capital is calculated as the sum of the basic risk-free rate of return and the β-coefficient of the asset's sensitivity to changes in market returns. Thus, the equity rate is the expected return of investors buying shares of the company. It is expressed as follows: Investors' expected return (future) = Risk-free rate of return (future) + company's β (relative measure of volatility) × Equity risk premium (history).
The equity risk premium represents the return above the risk-free rate of return that investors expect from investing in risky assets. So, if the risk-free rate of return is 7%, β is 1.1, and the implied risk premium is 4%, then the company's cost of capital will be: 7% + (1.1 × 4%) = 11.4%.
The cost of borrowing is the rate of return at which a lender provides borrowed funds. To determine this rate, it is necessary to calculate the profit. This is usually done using discounted cash flow analysis. The cost of borrowing must be calculated after taxes as follows: Cost of borrowing after taxes = Cost of borrowing before taxes x (100 - Marginal Tax Rate).Measurement frequency
Economic value added is calculated on a monthly basis. The weighted average cost of capital is determined on an annual basis.
The source of information is the balance sheet data.
Collecting data to calculate economic value added requires somewhat more effort than for other financial indicators. The more accessible the required data, the cheaper and faster the EVA calculation will be. If the data is available, then all you need to do is create a new formula in the accounting system. However, if important data is lost, restoring it can be very costly.
Target values
Performance in terms of economic value added can be assessed by comparison with the performance of organizations with a similar risk profile.
Example. Consider the example of a company that designs, manufactures and sells home furnishings (example taken from James Creelman's Building and Communicated Shareholder Value, London: Business Intelligence, 2000). All figures are in thousands of US dollars.
EVA is used as a way to evaluate an organization's investment. Let's take the example of a packaging line that is no longer meeting customer requirements. The new line will help the organization generate additional income as well as reduce packaging costs. The total effect is estimated to be an increase in profit after tax (net income) of £2 million. However, additional operating capital of £7.5m is required. Assuming a cost of capital of 11%, we obtain the following results:
- Increase in net income (NOPAT) - £2 million.
- The cost of additional operating capital (11% of 7.5 million) is £0.8 million.
- Economic value added = 2 - 0.8 = £1.2 million.
Notes
The introduction of EVA is more a change in corporate culture than a financial one. Organizations must ensure that they have created a culture in which economic performance is much more important than just profit and loss.


