This will be one of the shortest lessons. It's funny, but such a banal topic as indicators is difficult to describe with psychological point vision. It is because of indicators that beginners have so many problems with trading in the initial stages. I had them too.
A novice trader needs a foothold. This whole price on the charts looks so unpredictable, especially when the first enthusiasm subsides and you realize that it is not bouncing like a ball at all from the support and resistance lines. When he wants, he breaks them, sometimes he teases them and supposedly breaks them (false breakouts), and sometimes he seems to specifically bounce when you are waiting for a breakout. My head is spinning, my deposit is decreasing.
The indicator is strict and clear. He has clear rules, he often even shows with arrows where to enter. There’s just one problem with the indicators...
The indicator shows only the past
And it's right there in the title. This is what beginners, and often even experienced traders, do not understand about indicators. They forget how any indicator works. And this:
Mathematical operation on past data.
Do you understand? The indicator cannot “predict” the future. It is based on a very simple formula. Let's say we took 14 candles, minimum price, maximum, we cheated a little, bam - we have a stochastic. But what does it show? Past price data. I will save you a lot of time if you immediately understand the simplest trading truth:
The indicator does not predict the future. It only shows the past.
Indicator structures past data, but is not able to look into the future even 1 point. We will do it for him, with our trading brains.
For this reason, trying to trade using indicators alone usually fails. This is not surprising. The child could trade MACD crossovers or oscillator lines. Moreover, any programmer who has mastered “C++ in 21 days” can easily write a trading robot that will make such entries automatically.
And they are all tested. All popular indicators of the world. On the TradingView platform you can find ready-made strategies with them that can be run on history with one button and show the results.
And there it turns out that any naked indicator strategy, shamelessly waving its arrows, looks completely indecent, because it, in itself, only loses money in any foreseeable period.
This, by the way, is one of the misconceptions of beginners. They believe that if the indicator gives results for a day or a week, then they have found the “money” button. In fact, they only got a short-term piece of luck from the theory of probability. The longer the historical period over which the indicator is tested, the more losses it will ultimately show.
Why are indicators needed?
We have already come a long way:
And indicators can become a useful addition to these topics - to technical/fundamental analysis. They can complement your understanding of the market and become a good helper who will come to the rescue in difficult times. But this is not a shining knight in armor who will save you if you do not understand what is happening with the market.
The indicator is not capable of this. It carefully organizes old prices and helps you understand what was happening in the market before you made a decision right here and now.
- If you regard indicators and indicator systems as a supplement, they will help.
- If you rely only on them, beware, you are asking too much from a simple formula.
No matter how beautiful the indicator looks, it is only a formal structuring of old data:

Initial indicators for binary options
The most popular indicators are slowly described on the website. I don’t like to read muddy texts written by people suffering from technical brain confusion, so I give the simplest descriptions.
So far the following have been described:
IN public library TradingView contains thousands, many thousands of indicators and indicator systems:

150 indicator systems
I also spent a lot of time collecting and classifying indicator strategies for binary options. The result is a catalog sorted by timeframe. On the forum you can download them for MetaTrader or use them immediately on your live chart.
The indicators there are very different: arrows, trend indicators, reversal indicators, with redrawing, without redrawing, green and grey-brown-crimson. The choice is luxurious, for every taste.
The best and most accurate indicator for binary options
You have already gone through enough training stages in ours to understand that there is no such miracle. But that's good. Why?
Imagine that some asshole got an indicator that is guaranteed to ensure successful trades. Where would we all be then, together with the brokers? It is only because technical analysis is an imprecise, subjective science that the market breathes competition and the patient take the money of the weak. Here, control over emotions, the ability to manage money and risks, rather than specific systems, are much more important. If a citizen or a group of citizens appears here, “vanging” the market without fail, the time will come to dry crackers, and for everyone at once.
Luckily, it's fantastic. Always predicting the market accurately is like predicting the future of your country from history. The general vector can be approximately determined, but the exact one cannot. So our government, having dropped the ruble almost 3 times, is doing big eyes and is justified after the fact.
A certain Sechin managed to incorrectly predict the price of oil 7 times in a row. Eh, guys. If the head of Rosneft 7 times in a row cannot predict the price of oil (and he is supposed to, by virtue of his position), what can we expect from some indicator for UKOIL (Brent oil ticker).
What is a reliable indicator for you personally?
This is a good question. Because over time you understand which indicator is really good for you personally. For you have studied it inside and out, in a variety of ways. market conditions. Only after hundreds/thousands of hours of testing can the indicator become “native”.
For me, these were Bollinger Bands and Stochastics. I love the classics. I don't need complex systems. The basis of my work is Dow theory with a significant admixture of fundamental analysis. And these two indicators are help, and then only in some cases. Often there is no need for them at all.
Bollinger for me is a channel volatility indicator. It's such a big worm, its sides swell with volatility or shrink when the worm is starving and the price barely moves. Volatility as a reflection of the cyclical strength of the market helps when dealing with support and resistance.

Well, I use stochastics exclusively in sideways movement (consolidation). In my experience, this is where the stochastic shows itself in the best possible way, and its overbought and oversold conditions ensure filtering of entries from the p/s. The stochastic has many tricks, described in the articles of its creator, George Lane.
For example, Stochastic RSI is good in the overbought/oversold zone at the 2nd successive top, which is slightly lower than the first, with moderate sideways price movement:

And there are a lot of such tricks. There are “hooks” that it forms under certain conditions, but divergence is generally a powerful tool. This way the indicator will become a whole world that you build into your system.
Only after gaining many hours of experience will you be able to say that yes, this is an excellent “turkey,” as traders jokingly call indicators.
Binary options without indicators
Is it possible to work with binary options, and even Forex, without indicators at all? Undoubtedly. Have you forgotten that the charts are just price movements? This is just a column of numbers, and a graph is their visualization. You can predict price movements using simple lines and graphic figures.
However, many people forget that Japanese candlesticks are also an indicator. Therefore, when we use candlestick combinations, we use, so to speak, a base level indicator.
And of course, I gradually incline everyone on the site to indicator-free trading, be it price action or the foundation in the form of the Dow Theory and support/resistance. My work schedules often look like this:

Non-indicator trading involves extensive use of:
- technical and fundamental analysis;
- candlestick patterns, figures, their combinations and behavioral models;
- moving averages as an alternative to trend lines.
At its core, indicator-free trading helps you understand the essence of markets and teaches you to perceive their movements without numerous crutches.
Choose your indicator
So, let's summarize. There are tens of thousands of indicators, and they all show the past by structuring old data. Therefore, there is no need to sort through hundreds and thousands of them. You just need to choose your favorite indicator, thoroughly study its operation in different market conditions and integrate it into your trading system. This way you will get an excellent working tool.
If you fanatically enter on the arrows of any indicator, forgetting about technical analysis, Dow theory, news and other trading elements, you will be disappointed. So take indicators soberly - as an additional assistant, one of the elements of your trading system, which is patiently created for yourself.
There is no need to rely on the indicator as a magic wand. He does not work and cannot work in this capacity. This is just an assistant, sometimes useful, but often there is no need for it.
- Back:
- Forward:
Good afternoon, dear readers and visitors of our site. Today we will look at the best basement indicator for binary options, Xmaster formula. Naturally, it is the best - this is a strong word, however, it is a very interesting tool that can definitely come in handy if you are creating your own strategy.
I am sure that with the right approach, this tool can be used without special effort include it in any strategy where it will become a worthy filter. Of course, you must understand that by installing this indicator on the chart, you will not suddenly begin to accurately determine market movements.
Reflections on Martingale
Many people may say now, but you can work according to . You know, everyone has their own opinion, but let's face it, Martingale is an incredibly aggressive method of money management that has destroyed not a single deposit. The less trading experience you have, the faster Martingale will empty your pockets. You can get out of losses for a long time and tediously through this method, but one day will come when you run into a recoilless movement.
Naturally, under such conditions, you will not have time to blink an eye before you lose all your capital. Believe me, in this case not a single indicator will help you. I have never met a person who used Martingale aggressively and ended up not merging. No, I'm not saying that this approach cannot be used at all. In principle, it is possible, but it must be done very competently!
In any case, I do not recommend using it for novice traders at all, because for them this is a direct path to complete loss capital. Therefore, until you gain experience in trading, do not even think about using Martingale.

How this tool works and its settings
Now let's talk in more detail about our indicator. Of course, this is an interesting and easy-to-use tool, and once you install it on a chart, you immediately understand how to use it. I think that even a novice trader, once he installs this indicator on the chart, will easily figure out how to use it.
As far as I understand, this tool does not redraw its values. However, I recommend that before using this indicator, you check it for redrawing yourself. I've been watching this indicator for a while, so I can't say for sure whether it redraws or not. But, as far as I understand, there is no redrawing. By the way, you can reflect on the topic: you can follow this link.
We can use this indicator on absolutely all time intervals, but I have observed that it works well on M5-M15. As for underlying assets, I recommend that you consider the main currency pairs. At the same time, I want to give you advice: you shouldn’t take many pairs at the same time. Literally 3-4 assets are enough for you to trade normally.
It’s just that if he sets par 10, then you will simply get confused, your eyes will run wild different sides. Take my word for it that this will make your trading very difficult. Choose several trading assets for yourself and trade calmly, do not chase the quantity of signals, but chase their quality.
Download
As for the indicator settings, there are simply none; there is nothing to configure. Naturally, in this case, your task becomes even easier. You will not need to waste time on tests to select the optimal indicator parameters for yourself. Roughly speaking, you don’t need this, just install the indicator and work.
How to use it
Now, let's talk in more detail about how to use this indicator in practice. Everything here is quite simple, first of all, we need to pay attention to the arrows. You will not miss the appearance of the arrow, as an alert will appear that will warn you about its formation.
As soon as the arrow appears, we need to wait for the current candle to close, and when it closes, we purchase an option with , which is three times larger than your time interval on which you are working. For example, if you work on the M5 interval, but then you need to take an option with an expiration of 15 minutes. To help you understand better, let's look at an example!

Here we can see that an arrow appears, which indicates that you can purchase a put option. Given the fact that we have a five-minute interval ahead of us, we take a put option with an expiration of 15 minutes. Ultimately, we see that the deal worked out. To be honest, the indicator shows short-term changes in trends quite accurately, however, from time to time there are a series of losses. This is why I do not recommend you use Martingale.
Here, in fact, you see that using this indicator in practice is simply incredibly simple. I don't think you'll have any problems here. However, even within the framework of binary options, I recommend that you use this indicator only within the framework of some systematic approach. You know, it will show itself quite well as a signal indicator.
Watch a video review about the indicator
Just a couple of filters are enough to additionally filter out many false signals. You should not install a huge number of indicators at once. Believe me, this will be of very little use! I often come across such moments when a beginner installs a good dozen indicators and thinks that now he will begin to accurately determine entries. But I can say from my own experience that this kind of manipulation will only cause problems, because all these indicators will contradict each other, creating a bunch of problems.
In general, the presented indicator is quite interesting, and with a competent approach it will allow you to create quite an interesting trading strategy based on it.
There are hundreds of them. And every year dozens of new ones appear. Some help make a profit in financial markets. And others are practically useless or are plagiarism of their predecessors. We are talking about technical indicators.
The indicator method of market analysis is the most popular among novice traders. But many people use it incorrectly, which leads to drainage. Therefore, today we will not just give a list of the five most reliable indicators for binary options, but also tell you how to independently choose an instrument for trading, what to look for, and what mistakes speculators make when working with instruments.
How traders choose indicators
- They rely on a visual picture. That is, the trader selects a random indicator, places it on the chart, looks at the readings on history, and experiments with the settings. We liked the results and continue to use them. Let’s not say that this method is wrong, because if it is used, then the method works. But personally, this option is not very suitable for us.
- Study technical parameters. These traders are sure that you should never use a tool if you don’t know how it works. This does not mean that you need to memorize the calculation formula, but, at a minimum, you need to understand the principles of the indicator’s operation. This approach is closer to us. However, we repeat, you can try to choose an indicator without studying technical formulas.
Why do we recommend learning the technical side of a tool before working with it? Traders rarely work with only one instrument. And when 2 or more “turkeys” are used, disagreements may arise between them. And who then to believe? If you know the technical aspects of everyone's work, similar problem will not arise.
Why are indicators from the terminal better than new tools?
In the following articles we will talk about both classic analysis tools that are installed on many terminals and platforms, as well as those that have not yet earned such recognition. But looking ahead, we note that in the list of reliable indicators for binary options, which is offered below, only classical tools are presented.
We do not believe that all modernized and young systems are not worthy of attention. But today we decided to talk about the best indicators for binary options, and they, in our opinion, have not yet matured to that level.
The first reason is that standard “turkeys” are time-tested. Let's remember what MetaTrader offers traders to use in their market analysis: MA, Stochastic, Bollinger Bands etc. Most instruments were created 20–40 years ago. Today they are used by professional speculators from all over the world.
The market is unpredictable, but at the same time it is cyclical. Therefore, despite their age, the same Bollinger Waves continue to regularly show traders the situation on the market.
The second reason is that the indicators in the terminal are free. They used to cost a lot of money, but today they are available to everyone. Of course, new tools can also be downloaded for free. However, many cost money.
The third reason is You can find much more information using classic indicators. Some of them even have books written about them. But there is much less information about new tools. You can find information on searching for signals and reviews of effectiveness. But often developers decide not to share information about how their tools work.
How to choose the most reliable indicator
Below we will only talk about five proven tools. But this does not mean that everyone else can be ignored. They can also help with market analysis. Moreover, each of them can become one of the reasons for losing the deposit. It all depends on how you use them.
First of all, when working with turkeys, you must understand that indicators are not providers of direct entry signals. They only show the situation on the market. Moreover, everyone has their own algorithm with which they do this. You should not blindly trust the instrument's readings.
After this, you should decide which category of tool you need. Almost all of them are divided into 3 main categories:
- Trend - show the direction of the trend. Signals are either synchronous or delayed;
- Oscillators often give leading signals. They can be divided into 3 categories. The first one works relative to the zero line. Second, they work on the price field. The third one works with areas of market overheating.
- Volumes – useful tool. But MetaTrader shows tick volumes - the number of ticks for a certain period.
- Bill Williams indicators are a separate category of tools developed by Bill Williams.
Decide for what purposes the tool will be used, read in detail the rules for constructing and using a specific indicator.
List of the best
Let us remind you again. Each trader may have his own best trading tool. The main thing is to understand it. If you know how to work with RSI, it will be the best. If you successfully trade with Volume, work with it. Below are the five most reliable indicators for binary options trading.
- Moving Average– the most popular trendy “turkey”.
- Awesome Oscillator – developed by Bill Williams;
- RSI is one of the most popular oscillators;
- Fibonacci levels – no one has canceled mathematics in trading;
- The Ichimoku indicator is a tool on the use of which books are written.
Now a little more about each of them. However, we note that we will not fully describe all the intricacies of using each, since one article will not be enough for this.
Moving Average

The moving average line shows the smoothed direction of the price over a certain period. For example, we set a simple moving average (SMA) with a period of 5 and apply it to closing (Close). Now let's calculate what value the moving average will be at.
Closing prices of the last 5 bars: 1.01000, 1.03400, 1.04400, 1.02500, 1.07000. The MA line will be located at 1.03660 (the arithmetic average of the closing prices of the last 5 candles). This is an example of calculating SMA. But there are others: EMA, WMA, etc. They are calculated in a slightly different way.
Trading with MA is different. Someone uses it at the same time. Some people prefer to set large periods (more than 200) and use them as support/resistance levels or on pullbacks. And someone uses MA with other instruments.
RSI – relative strength index

Displayed in the window below the chart. This is a line that moves in the range from 0 to 100. In this case, two levels are marked: overbought (upper) and oversold (lower). By default, the levels are set at 30 and 70.
When the RSI line goes beyond one of the boundaries, we should expect a price reversal. But this does not mean that after the line crosses level 30 from top to bottom, you should open a bullish trade.
Let's consider the principle of forming the main line of the oscillator. RSI determines the strength of a trend and the likelihood of it changing. We will not give a mathematical calculation formula, since it is not so important.
A downward signal is crossing level 70 from top to bottom. But an increase is a breakdown of level 30 from bottom to top. However, if you look at history, you will notice that the RSI often gives false signals. Therefore, you need to either supplement it with other tools or change the parameters. But the main thing is not to trade against the trend. That is, during an upward trend, ignore all downward signals.
You can also determine the trend using the RSI itself. To do this, set the period to 210 and leave only 1 level 50. When the line is above it, the trend is upward. When below - downward.
Other subtleties of trading using the Relative Strength Index are described in the video below. We recommend watching it.
Awesome Oscillator

This product by Bill Williams looks like MACD, only without moving averages. The instrument is based on previous quotes and is slightly delayed in its readings. Therefore, AO is not the best option for short-term trading.
Unlike MACD, the Awesome Oscillator histogram is built not based on prices, but based on their medians. Green bars are formed during an upward trend. Red - during periods of downward movement. Simply put, the indicator shows the strength and direction of the market.
The histogram is built on moving averages. The zero line around which the AO bars are built is the intersection of moving averages. Accordingly, Awesome Oscillator can, to some extent, replace MA. If you remember, one of the main signals for moving averages is crossover. Accordingly, breaking through the zero level on AO is also an entry signal.

In addition to the crossover, the Awesome Oscillator also gives 2 other signals. We will definitely talk about them in the following articles.
Fibonacci levels

Beginners are often afraid to use the tool because they think it is too difficult. But experienced traders can confirm that this is one of the most reliable indicators for binary options. Therefore, we recommend that you study the rules for its use.
In any trend, pullbacks occur, and Fibonacci levels are used to identify correction zones. We will not describe the rules for constructing and using lines now, since it is difficult to describe everything in a nutshell, but we will devote one of the following articles to a full review of the tool. In the meantime, we recommend watching this video.
Please note that Fibonacci Lines are best used on time frames H1 and higher.
Cloud Ichimoku
For full description indicator, experts write books and record videos lasting 8 hours. Therefore, obviously, now we will not be able to tell you how to use it. But we promise that after the publication of this article we will begin preparing material on each of the tools mentioned.
Ichimoku consists of 5 elements that give several input signals at once. Like Fibo lines, this indicator is rarely used by beginners. However, once you understand it, you can develop an effective trading system.

Each of the tools proposed above can be the best indicator for binary options. Decide for yourself whether you will be among them. If you are interested in at least one of the described tools, be sure to wait for the release of a detailed article with a description and trading strategy. And so as not to forget, add it to your bookmarks.
This section will look attechnical analysis of binary options, namely indicators technical analysis, most often used in trading.
Here we have collectedbest indicators for binary options, which provide high performance compared to exotic types of indicators. These are the most common and most effectiveindicators for binary options.
A description is provided for each of them so that you, as a trader, understand the working mechanisms of each indicator for more effective trading.
In this section you will find a strategy that combines 3 very popular indicators. For ease of use, our programmers have written an algorithm so that you can use this profitable strategy. In the services section, you can watch a video that demonstrates how this indicator works and what signals it produces.
In addition, you can download the platform with built-in indicators on. The Thinkoswim platform allows you to write your own indicators, watch CNBC online, and listen to the radio. The demo version has a huge number of indicators built in, so every trader can find the one that suits him best and according to his strategy. The interface is easily customizable. In my opinion, this is one of the best platforms for analysis. stock market. Use the instructions for installing the terminal (MT4) to work with our new development
Dear friends, we are pleased to inform you about a real breakthrough in binary options trading! Our developers managed to create a new, unparalleled indicator for binary options trading!
The company's development is called eSignalsTrendFilter. The indicator generates a signal at the moment when an absolute minimum or maximum is reached, followed by a reversal or correction.
Find out more by clicking on this.

Video lesson on technical analysis indicators:
Here you will find from Practicalbinary
Bollinger Bands
This indicator was developed by John Bollinger to determine volatility (the amplitude of price fluctuations). This indicator is constructed in the form of an upper and lower boundary around a moving average, but the width of the band is not static, but is proportional to the standard deviation from the moving average for the period. Thus, Bollinger Bands tend to contract and will expand as market volatility changes.

Trading signals are considered to be breakthroughs of the indicator boundaries from above or below. Also one of important properties Bollinger Bands is that the price tends to return to the moving average in the middle of the indicator, which usually occurs after a bounce from one of the indicator's boundaries.
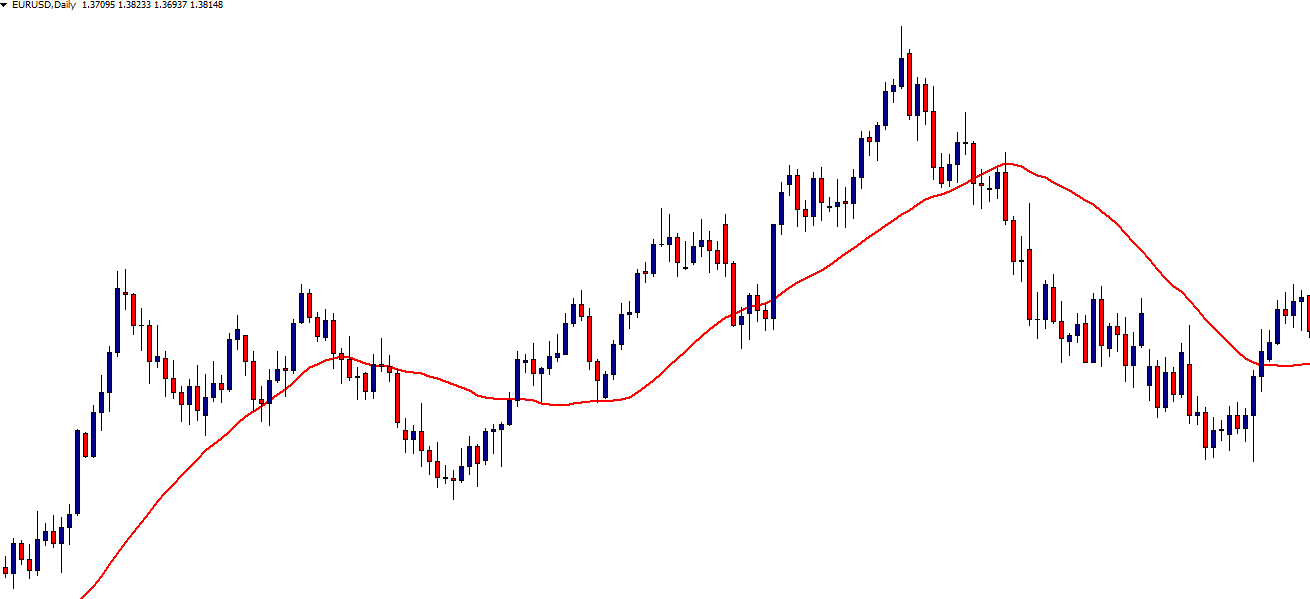
Moving average(MovingAverage)
This is an indicator that shows the average value of a function for the previous period at each point of definition. Moreover, the construction period (the number of time series over which averaging is carried out) is selected by the trader depending on the instrument and the specific market situation. It is important to know that the longer the period you take, the more smoothed the average you will get, and accordingly, the slower it reacts to price dynamics. Well, accordingly, the less smoothed the moving average is, the more quickly it reacts to price dynamics.
There are two main types of moving averages:
1. Simple Movement Average
2. Exponential Movement Average
So let's start with simple (SMA)
This is what a simple moving average with a period of 30 looks like
A simple moving average is the simplest type. It is calculated by adding all closing prices for the number of periods “N” and dividing by the same “N”. Nothing complicated. On the chart, the slope of the moving average will show us the direction of the trend in the market. One problem with the moving average method is that it is susceptible to market spikes (a candle with a long shadow). Have you thought it's starting? new trend, and took the movement as a signal, but nothing actually happened.
Now let's look at the exponential moving average. An exponential moving average is a type of weighted moving average whose weights decrease exponentially starting from last value, in the case of a time series, and are never equal to zero. This means that the exponential moving average gives each value in the calculation a certain weight, with more weight given to prices from more recent periods.

The green line (30 EMA) is closer to the price than the red line (30 SMA). This means that exponential average reflects price dynamics more accurately than simple average. This is because the exponential moving average EMA puts more emphasis on recent price action. Naturally, in real situation we are interested in what is happening with the price chart now, and not a week or month ago.
IndicatorMACD(MovingAverageConvergenceDivergence)
The MACD indicator gives us 2 values at once: the strength and direction of the trend. Also, MACD can be used to find turning points.
MACD is a dynamic indicator that follows the trend of price movement. Typically the MACD is drawn as a histogram and its smoothed moving average is shown as a signal line. MACD histogram = Fast MACD line - Slow MACD line, the zero line of the indicator shows the level at which the average prices of two periods of exponential averages are equal to each other. The indicator value above the zero mark shows an increase in prices in the short term in relation to long term, i.e. uptrend and back. A signal such as the MACD crossing the zero line from top to bottom gives us a signal to sell, and the opposite signal, about an uptrend, when the indicator crosses the zero mark from the bottom up. The MACD is also quite valuable as an overbought-oversold indicator. When we see that the signal line crosses the indicator histogram from top to bottom, this means that the price on the market is too high and may return to a more realistic level. And the opposite situation with the signal line crossing from bottom to top is a signal for a bullish trend.
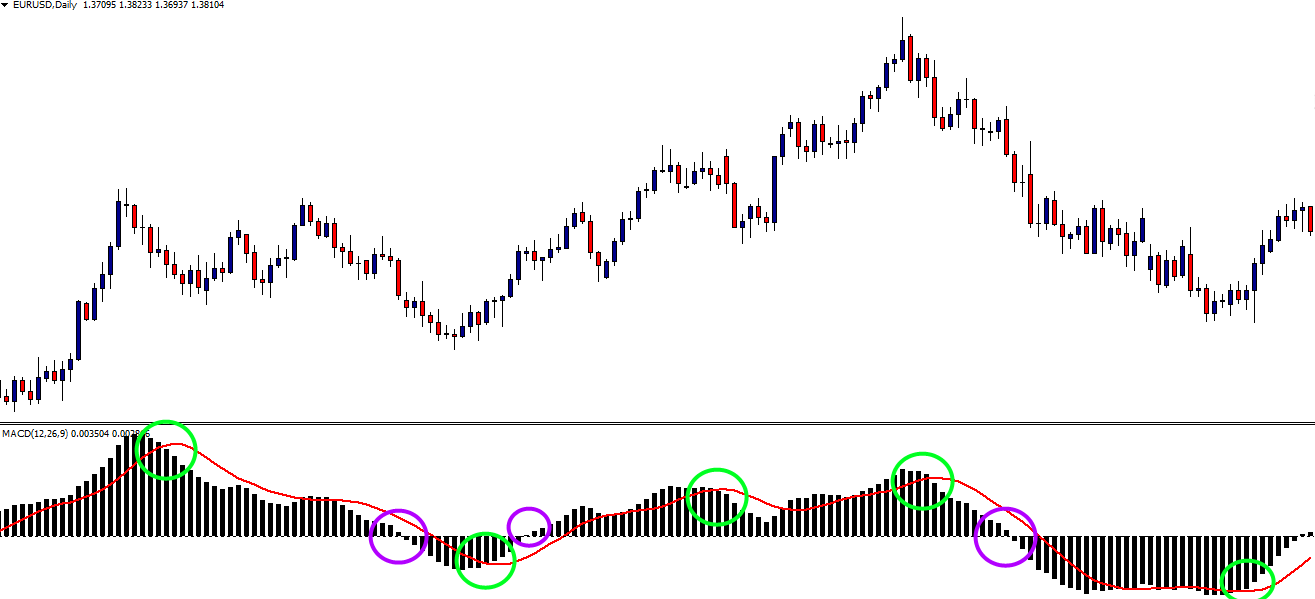
Divergence or divergence is a rare signal when a divergence forms between the price and the histogram, this warns us about a weakening trend and the formation of a new trend. There are bullish and bearish divergences. We see a bullish divergence when a new high on the price chart is higher than the previous one, and the same new high on the indicator chart is lower than the previous high. Also, the discrepancies between the new lows between the price and the MACD histogram on the chart tell us about a reversal in the market movement for bearish divergence.
The disadvantages of this indicator include its delay in the formation of new trends and the presence of false signals when used on short time frames.
Indicator Parabolic SAR
Parabolic SAR is an indicator that was developed by Wales Wilder as a method of identifying potential directional reversal points. market price. Parabolic SAR is an indicator that follows the market trend, which means that the indicator readings lag in the short term.
How to trade using Parabolic SAR? This indicator places points on the chart that indicate potential trend reversal points. On the chart you will see points whose location above the trend line signals a downward trend. And immediately the dots move under the chart when an upward trend emerges in the market. We will trade using this indicator based on buy signals: when 3 to 5 dots appear above the chart, a signal to buy a put option will be received, and the opposite situation will occur when 3 to 5 dots appear below the trend line - a signal to buy a call -option.
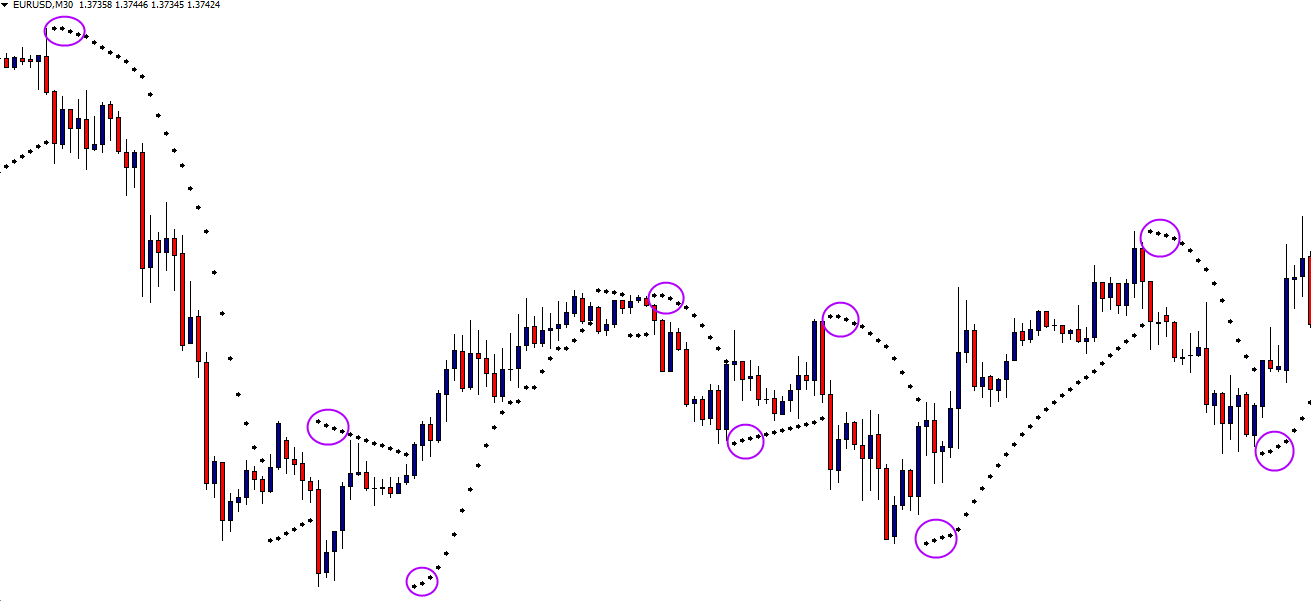
Parabolic SAR is quite easy for a trader to interpret signals as it only gives signals when the price is either rising or falling. It can be concluded that Parabolic SAR works best in markets with good trends. For example on foreign exchange market. And on assets with high volatility and sideways trends, this indicator will show poor results.
Stochastic or Stochastic Oscillator
Perhaps it's worth starting with the definition of an oscillator. The name “oscillator” comes from the Latin “oscillo”, which literally means “swinging” or “swaying”. For the market, this means an analysis system whose indicators fluctuate or, in other words, repeat periodically over time. The stochastic oscillator determines the overbought and oversold state of an asset on the chart and consists of two lines: fast and slow.

On the chart, the indicator values vary from 0 to 100, where readings above 80 mean that the market is overbought and is a signal for the start of a downward trend. Accordingly, values below 20 indicate the presence of oversold conditions and signal the beginning of an uptrend. Everything is quite simple.
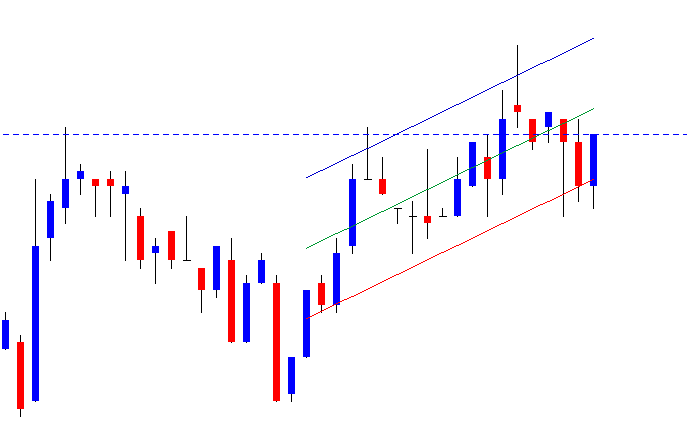
Raff Regression Channel
For lovers of quick, but by no means easy money. Here I mean traders who race the price curve at short intervals, namely, market participants who are attractedbinary options trading from 60 seconds to 5 minutes. Many people, comparing this type of trading with Forex, considerscalping for binary options.
An effective indicator that will help you manage price at short trading intervals is the Raff Linear Regression Channel, a technique developed by Gilbert Raff. Here the idea of working with the indicator will be the usual technique trading based on support and resistance levels.
The upper line of the indicator works as a resistance line and, accordingly, the lower line works as a support line. Positions can be opened for 1-2 minutes when the price rebounds from each of them towards the central equilibrium line.
Prices may go beyond the constructed channel, however long stay prices outside the channel usually precede a trend reversal. Well, in conclusion, I can add that trading at short intervals does not imply forecasting, but only considers trading technique. Therefore, I recommend using this indicator asstrategy for trading from 60 seconds up to 5 minutes.
Link where you can choose any chart convenient for you for trading! Also, to make it easier to find profitable trades, we have created a trend indicator that you can find with right side block on the site.
Choose the best binary options indicators and earn a lot. Good luck with your transactions!
The most accurate indicators for binary options, as well as for working on Forex, they help turn chaotic and unprofitable trading into truly profitable trading, giving speculators the opportunity to take a comprehensive approach to analyzing the market situation and choosing a reliable trading system.
To make the most accurate forecast of what is happening in the market (determining the strength of a trend, its direction, and so on), investors use free auxiliary tools that issue ready-made signals that provide the most accurate indicators in options trading.
What do you need to know? The most accurate indicators for binary options – their specialization
Free, but at the same time accurate indicators for options trading and the Forex market, by and large, are graphical reproductions of mathematical models that allow traders to determine with maximum accuracy the market trend, its strength, and also find the most suitable entry points into the market.
Most existing options strategies are mechanical and based directly on , so a fairly complex mathematical relationship is the foundation for creating profitable and effective indicators. However, this does not mean that you should perceive the generated indicator signals as something unchanging and static.

The market is in constant motion, therefore it is very changeable, and, consequently, new conditions for entering it are emerging. For this reason, the relevance of trading signals generated by indicators is extremely limited. The most accurate indicators for binary options require traders to effectively use certain knowledge and understanding of the basics of technical analysis in order to build trading models and understand what is happening on the chart. Otherwise, you may encounter difficulties in interpreting the signals produced by such indicators.
In general, free indicators specialize in automatically generating signals, and, therefore, in modern trading, no speculator should neglect such useful tools in trading.
How to choose the most accurate indicators based on signals? And which ones are better for binary options?
Online, you can find an unlimited number of various varieties (most of which are free) indicators, both for the Forex market and for binary options. Some are used to determine the strength of a trend, others to determine the direction of a market trend, and so on and so forth. All these technical analysis tools have their advantages and are used to create trading systems.
However, such wide range choice does not at all mean that you need to rush from one algorithm to another.
Quite the contrary, it is better to choose a few reliable tools and focus on working directly with them. Polish your trading skills with them and the result will definitely come.
To select optimally accurate indicators for binary options, you need to familiarize yourself with their basic parameters and then, the most interesting options test. Chasing all algorithm models at the same time will not give anything good and can lead to losing your deposit. Everything here may depend on specific situations and one trading system with a set of certain indicators today will bring a profit of several thousand dollars, but the next day it will not allow you to earn even a hundred.
Review of accurate indicators for active binary options trading
So, when considering the most accurate indicators for binary options, the first thing you need to focus on is a tool such as moving averages or MA. This indicator is perhaps the most common and simple, therefore it is widely popular, especially among beginners.
Using this tool, traders can determine the direction of the market vector. In other words, traders, based on MA (moving average) signals, decide in which direction to open an option - down or up.

– this is a task for trend indicators, the structure of which includes the MA. Here, to determine the trend and generate signals, you need to simultaneously use several charts with different time periods. The fact that there is a clearly defined trend in the market will be indicated by curves unfolding simultaneously in one direction, as in the examples below.

An accurate indicator, ideally not only determining the direction of a trend, but also the strength of the trend. They are also called counter-trend and are used after the trend has been identified. Signals from such instruments make it possible to determine when a trend is weakening in order to enter the market at trend reversals.
Stochastic, an indicator ideal for binary options
Such algorithms include the stochastic oscillator. This instrument has 2 moving lines moving in the range of values from 0 to 100. As a rule, when using Stochastic, its settings are set to the oversold and overbought areas.
They do this to determine the type of option being purchased. If on the indicator the price leaves the oversold area, then feel free to buy the “Call” option; if the exit is from the overbought area, then purchase the “Put” option.

Let's say Moving Average is used to determine the subsequent price movement, indicating the average value of asset values. As a rule, traders use several Moving Average instruments at the same time, since a signal about a change in the quote direction is the moment the indicator lines intersect each other. Let us immediately note that the longer you set the period of the indicator, the longer-term its signal will be.

The signal to buy a binary option is the intersection of the Moving Average with each other. And the direction of this intersection will indicate which option to purchase - “Down” or “Up”.

Accurate signals using Bollinger bands (lines) for binary options trading methods
The well-known Bollinger Bands are considered to be the most accurate algorithms or indicators for options, which are designed for trading in price channel. This algorithm shows the trader the maximum deviations from the average price value. An example of opening an “Up” trade is shown in the figure below. The “Down” option is purchased accordingly with opposite values.

One of the tools belonging to the Williams series of indicators, the Alligator, is also an accurate indicator in determining trends in binary options, as it is able to respond to the slightest fluctuation in quotes.
In addition, these indicators can be used independently; they can also be combined, thereby creating large number workers, profitable and interesting trading strategies. You can see an example of such a combination of moving averages in the example below.

As you can see, there is nothing difficult in using these indicators. But at the same time, the most accurate indicators for binary options will allow you not to play a chanceless lottery, but to earn stable income.
WE RECOMMEND VIDEO:
The most accurate indicator signals in binary options
We recommend reading
 Fusel oils in moonshine and other alcoholic beverages: influence, benefits, harm and purification
 Functional projections of zodiac signs What can be said about vector projection signs
 Degas E. “Blue Dancers. Essay based on the painting by Edgar Degas “Blue Dancers Dancers in Blue”
 We reflect in the RSV reimbursement of social insurance expenses for the last year Appendix 2 line 090 of the calculation of insurance premiums